
One resolved map
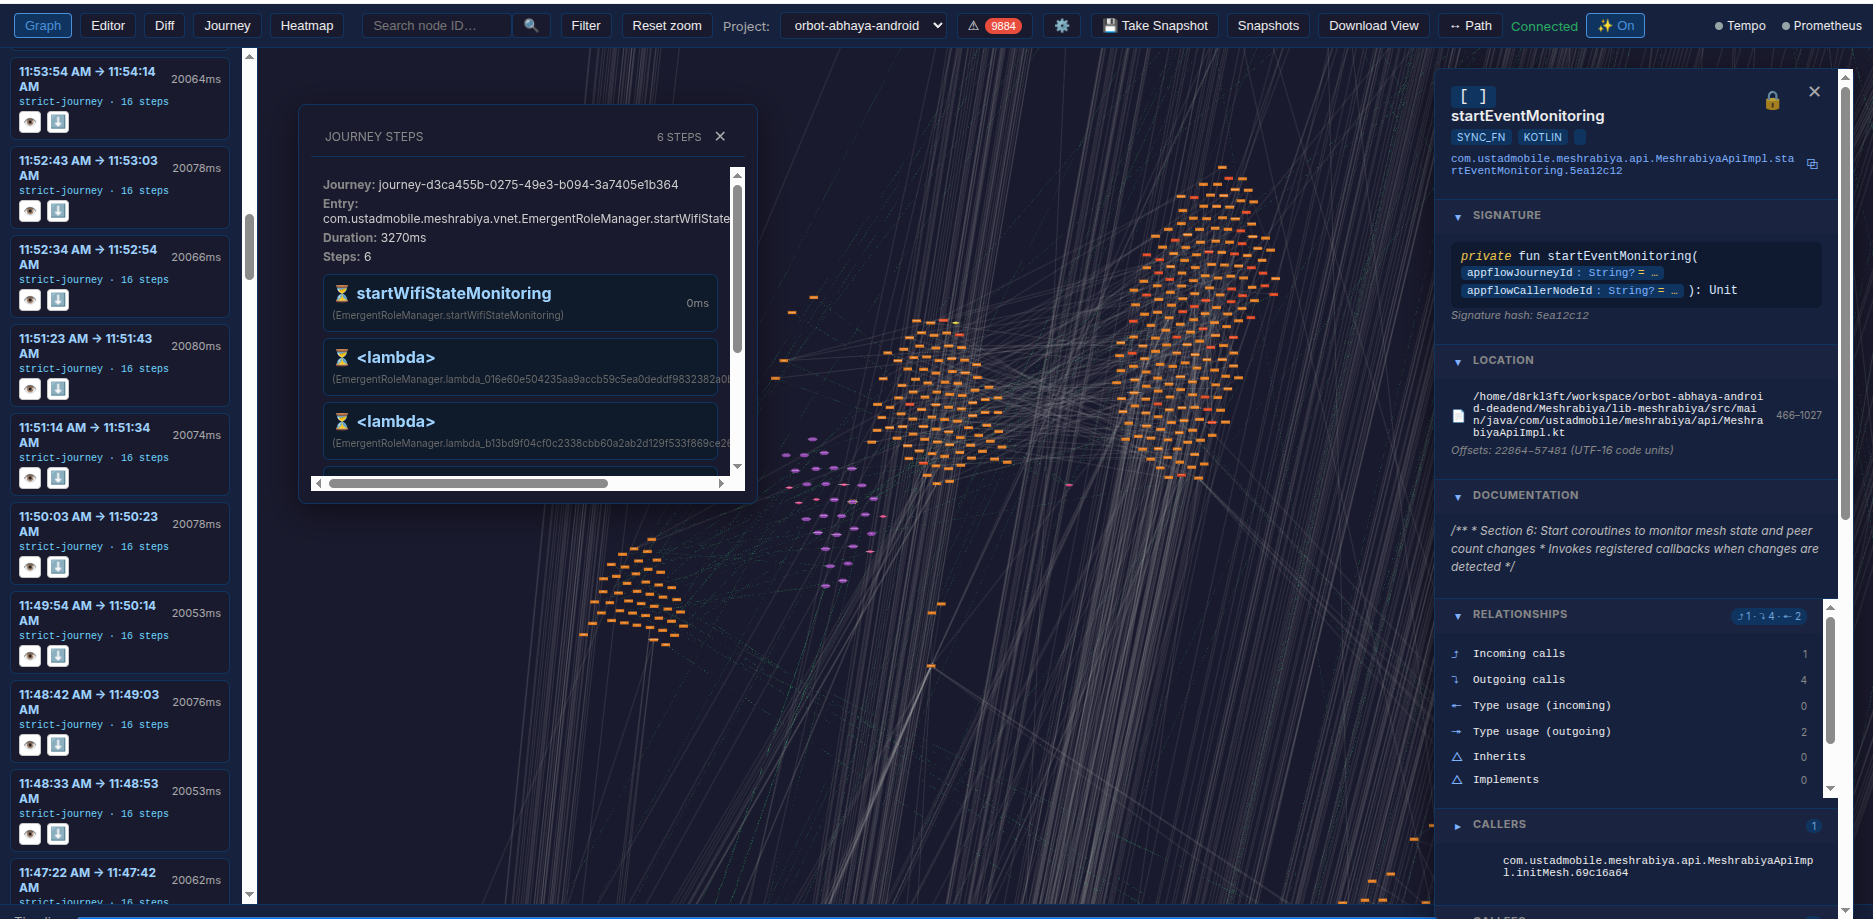
Static structure and live telemetry are correlated to the same node IDs, so a trace lands on a real function, not on a string that happened to match.
One map of the code, for engineers and agents
Your agent read fifty files to change three.
Poka Yoke gives engineers and coding agents the same resolved map of the code — and of what it does at runtime. Deterministic static graph, live telemetry overlay. The agent queries it through MCP; the human through the visualizer — graph view, filtering, graph edit and diff.
Free for individual use · Source-available alpha · Runs locally on your machine
Why it exists
Coding agents spend most of their budget discovering what already exists — call chains, overrides, interface implementors — and re-discovering it after every edit. On a small script, that works. On a large, complex codebase, it quietly drifts.
Static structure and live telemetry are correlated to the same node IDs, so a trace lands on a real function, not on a string that happened to match.
Generation is compile-based and makes no model calls, so regenerating the graph is free and cannot drift between runs.
Agents query the graph directly — callers, callees, path-trace, type hierarchy — instead of reading the whole codebase into a prompt.
Telemetry
The graph-versus-text-search case above is about structure. The same asymmetry applies at runtime — and it is the one most teams never get to test, because instrumentation is the barrier, not the querying.
Traditional observability correlates logs to code by matching strings — timestamps, thread IDs, logger names, stack frames. That is the same text-matching problem the graph replaces at the structural layer, carrying the same cost and the same fragility.
Runtime IDs are injected into the emitted byte code at build time, so a trace entry points at a graph node rather than at a string that has to be matched back to one. The relationship is semantic and already resolved — no scan, no join, no re-parsing.
A journey is a graph of traces over some subset of processing, aligned to the source functions it ran through. Because both sides are graphs, aligning an execution path to the code that produced it is a traversal.
The reason most teams never approach this at all is the instrumentation: wiring correlation through enough of the codebase that the picture is worth having. That heavy lift is what Poka-yoke removes. The graph is accurate enough to be trusted by a machine, not just read by a person — so the instrumentation is generated by deterministic scripts driven from the graph rather than written by hand. Correlation becomes a property of the build rather than a project. Telemetry lands in one structured schema, queryable from three pivots.
What traces were created during an execution journey through the application?
What traces were generated from a single function?
How do the objects in the codebase relate — function, class, property, package, file — and what semantic detail is available on each?
Who this is for
Two classes of consumer read the same resolved graph: the agent, through MCP, and the human, through the visualizer. The human class is not a single audience — it resolves into roles across two positions: the people who will use the product, and the people who decide whether to buy it. Each asks the same artifact a different question.
How it fits together
People use it through the visualizer; agents use it through MCP. The same artifacts sit underneath both.
Through the visualizer a person filters a large graph and inspects call sites, parameters, imports and data definitions. Through MCP an agent asks that same graph a question instead of reading a subtree into a prompt. See both in the deck below →
The offering
Eighteen capabilities across five layers — from automated graph generation and instrumentation, through W3C-compliant journey tracing, to human and agent collaborative editing with an attributed audit trail.
| Capability | Scope |
|---|---|
| Code graph | |
| Automated graph generation | Java / Kotlin, Python, JavaScript, TypeScript |
| Semantic vocabulary | Graphs use a robust semantic vocabulary for nodes and edges |
| Editable snapshots | Snapshots of the code graph can be created for feature planning, and used in validation tasks when diffed against new graphs of implemented code |
| Telemetry & tracing | |
| Automated instrumentation | Telemetry and IPC, for Java / Kotlin, Python, JavaScript, TypeScript |
| W3C-compliant strict journey tracing | Graphs of traces grouped by a journey, structured around caller and callee relationships between the functions emitting the traces |
| Standalone traces | Traces outside a journey, handled alongside journey-grouped traces |
| Session-based journeys | The traditional session-based journey available in OTLP implementations |
| Node, CommonJS, ESM, Cloudflare | Instrumentation support across Node module systems and Cloudflare |
| Visualization | |
| Smart graph visualization | Robust filtering tools, with overlay of incoming telemetry |
| Agents, humans & audit | |
| MCP tooling | Organized around code semantics and a relational model, pivoting the Code Lens and Execution Journey Lens on the traces received by the system |
| Collaborative editing | MCP tools and Edit tools in the Visualizer create an environment for human and agent to collaboratively edit |
| Edit audit trail | Maintained for graph edits, tracking who made each graph change — distinct from the intent-vs-implementation audit-trail property described below |
| Deployment & platforms | |
| Multi-repo, multi-language | Multiple repositories, and multiple languages within a repository, in one project |
| Enterprise environments | Dev, Staging and Production |
| Containerization | Compatible with containerization systems |
| Pipeline integration | Designed to integrate into existing pipelines |
| Android apps | Supported |
| Traditional Java apps | Coming soon |
The 60-second version
The product story, from "what it is" to "where it pays off". Use the arrows, the ← → keys, or swipe. Autoplay off by default.
Two things a buyer asks first
Two questions come up first in any evaluation. Both are answered here directly, with the basis for each figure stated alongside it.
On closure-shaped tasks — find every caller, thread a parameter through a call chain, correlate a trace back to the code that produced it — resolving structure by graph query instead of text search plus reading is modeled at up to 75% fewer tokens. The modeled range across the three closure sizes in slide 9 is about 3.4× to 4.5× less; 75% is quoted as the conservative end of that range.
These figures are modeled from representative closure-shaped tasks. A measured benchmark on real repositories is the next step, and will be published with the resolution rate reported alongside the savings.
The structural graph is authored before code is written, and the Fidelity Check compares implementation against it deterministically. What was intended, what was built, and where the two diverged are therefore reconstructable after the fact — without depending on an agent's own summary of its work.
An audit-trail property: a durable, reconstructable record of intent versus implementation. It complements your existing compliance controls rather than certifying against any standard.
Token figures on this site are modeled from representative task shapes. Third-party studies on the business page independently quantify the problem Poka Yoke addresses. Measuring Poka Yoke's own effect on real repositories is the next published milestone — and design partners get those results on their own codebase first.
Origin
Poka Yoke started from a specific irritation: vibecoding works fine on a small script and falls apart on a large, complex codebase. Not because the model gets dumber — because nothing in the workflow tells it, or you, when the shape of what's being built has quietly drifted from what was asked for.
The gap doesn't announce itself. It shows up weeks later as a bug nobody can explain, or never shows up at all and becomes technical debt with no paper trail.
The instinct that follows from that is old, not new — it's Deming's, from a Toyota factory floor seventy years before any of this: catch the mistake by the shape of the process, not by inspecting the output afterward. Applying that to code meant asking what the equivalent of a factory's physical jig or gauge would be for software. The answer turned out to be a graph — a structural map of what the code actually looks like, that could exist before the code does, be checked against the code once it's built, and keep being checked after it ships, against what the system actually does at runtime.
A second, personal influence shaped how that graph gets used day to day, borrowed from Heinlein's Waldo — build tools to build tools, and give an agent its constraints before its instructions, not after. That ordering produced better results than the more natural instinct of stating the goal first and hoping the constraints get respected.
“Poka-yoke” is a Japanese term from lean manufacturing — a mechanism that makes a mistake impossible to pass on, rather than a check that catches it afterward.
About
Poka Yoke is being built by Tyrone Thomas at BreakThrough Technologies LLC. The methodology is free and will stay that way; any commercial tooling built on it sits alongside it, never in front of it.
The alpha focuses on Android / mobile-mesh architectures — where static parse, compile-time accuracy, and live telemetry correlation genuinely pay off.
Availability
Platform, language and prerequisite details, so fit can be judged before the download opens.
The alpha is initially released for Linux. Windows and macOS builds follow once the parsers and the telemetry proxy are proven on it.
Multi-repository projects and multilingual repositories are supported as first-class — a unified view of your entire solution.
Grafana Tempo 3.0 or later. Poka Yoke correlates the live telemetry overlay against the static graph, and reads that telemetry from Tempo.
Free alpha
The alpha ships as a local-first bundle — parsers, graph generator, viewer, and MCP server — for evaluating the discipline on a real codebase. It is not available for download yet.
Coming soon
Support the work
Poka Yoke is built nights and weekends. If the methodology or the tooling has been useful, a coffee keeps the parsers fed.
Prefer your phone? Scan it — same page, no typing.
Contact
Design-partner conversations, bug reports from the alpha, or methodology questions — all welcome. We read everything.